
Map dashboards
I turn your data into an interactive map people can explore, with tables and charts beside it.
- Who it's for
- Product teams, publishers and start-ups building an analytics, operations or storytelling view around a map.
- Tools
- I use React, Next.js and Mapbox GL JS.
- How it is priced
- Fixed price per dashboard, set by how many views and data sources it needs. A first working version usually takes a week or two.
- How I work
- Six steps from brief to handover, with a written scope and price up front. I work remotely with clients in the USA and UK. See the steps
What you get
- Interactive map or dashboard, built for your data
- Map layers linked to tables, charts and filters
- API and data integration
- Performance work for large datasets
Work like this
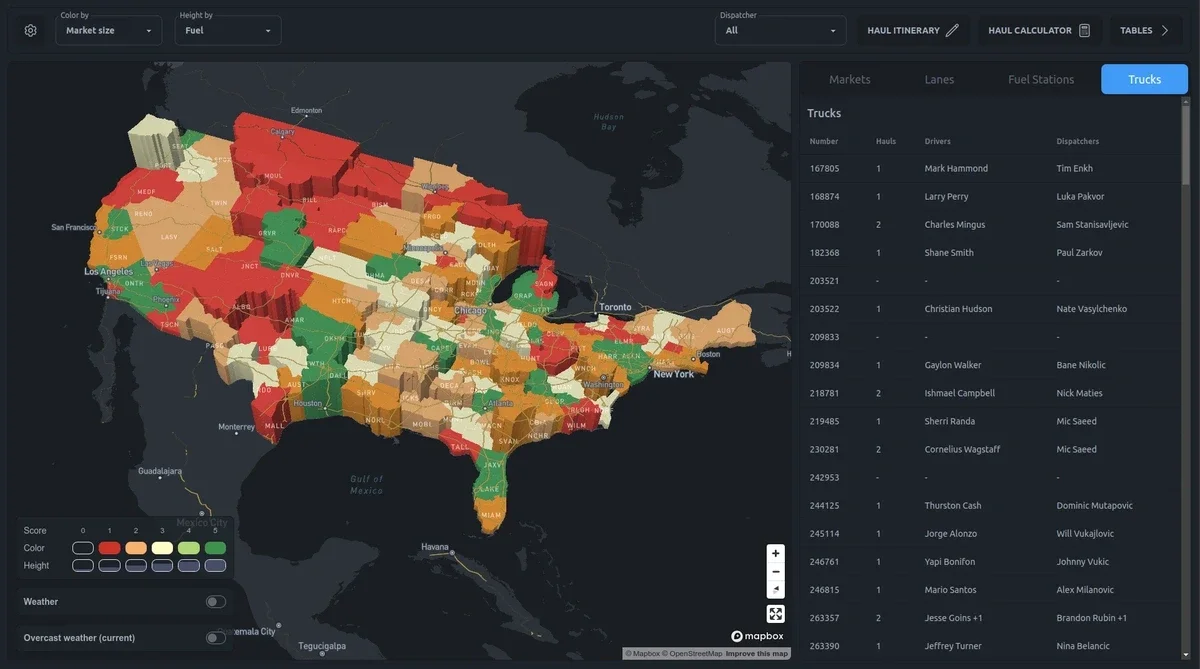
Map dashboard for freight logistics
Private Start-Up Client, 2024
Fleet management and real-time market analytics on one map
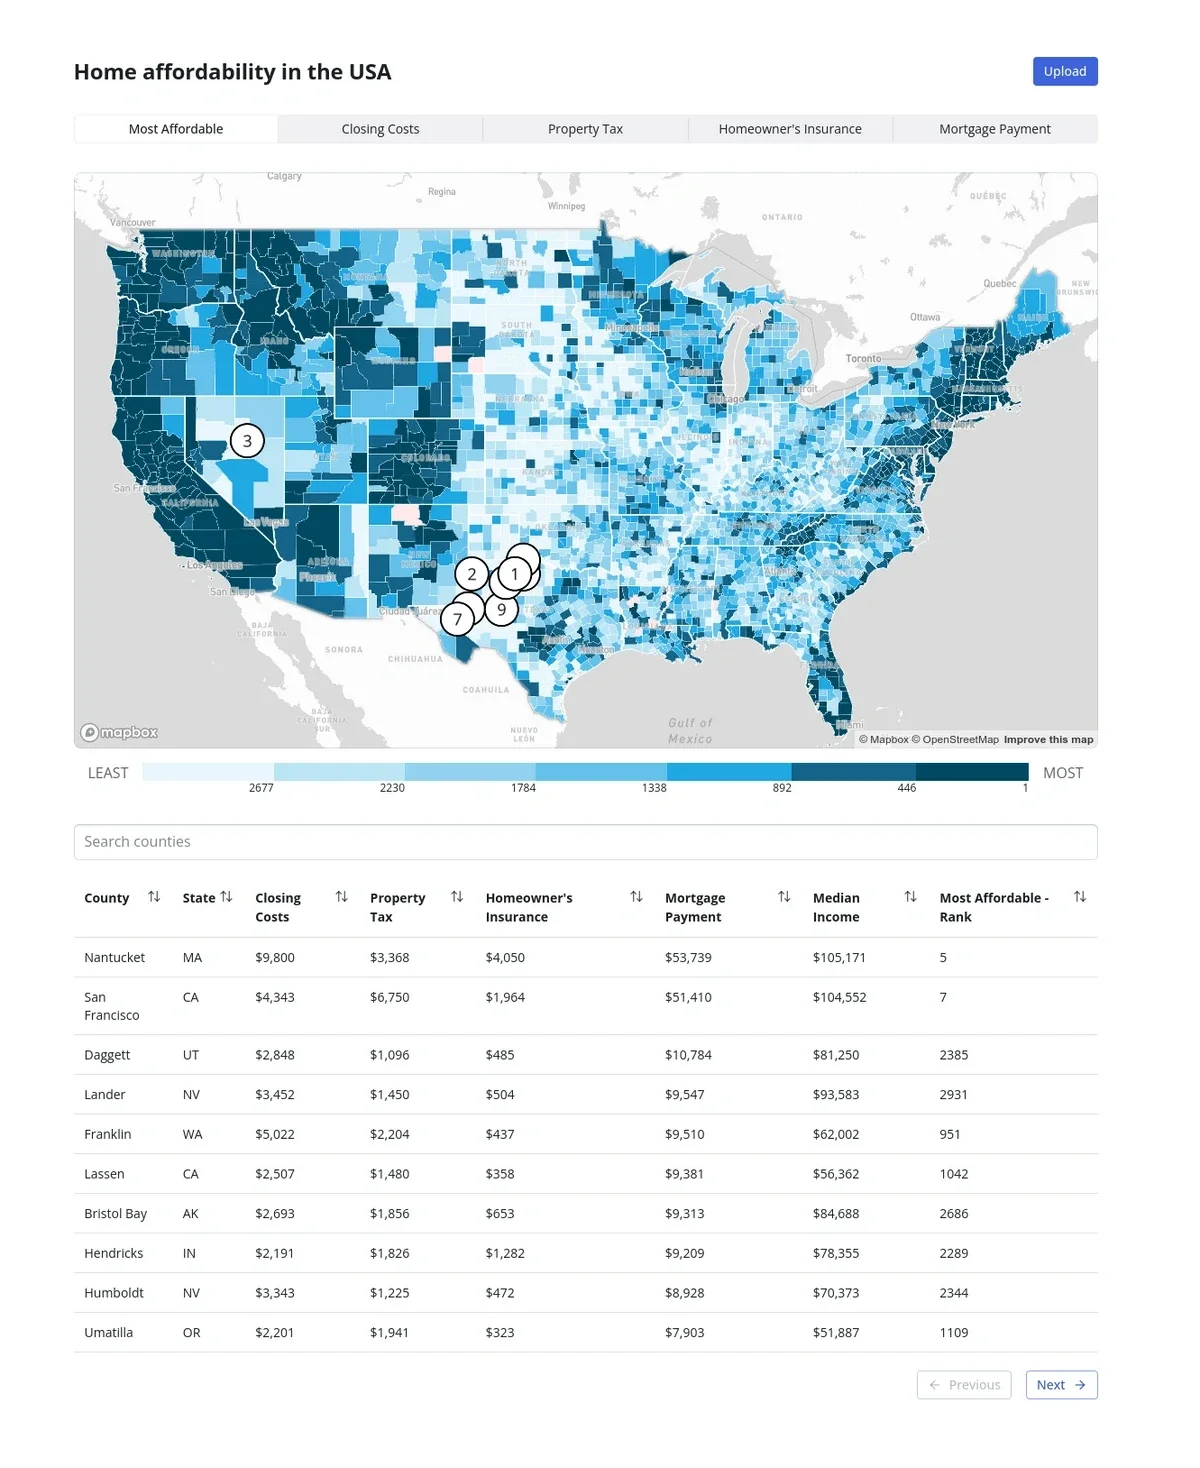
Home affordability map prototype
ConsumerAffairs, 2024
A choropleth MVP for a consumer advice platform
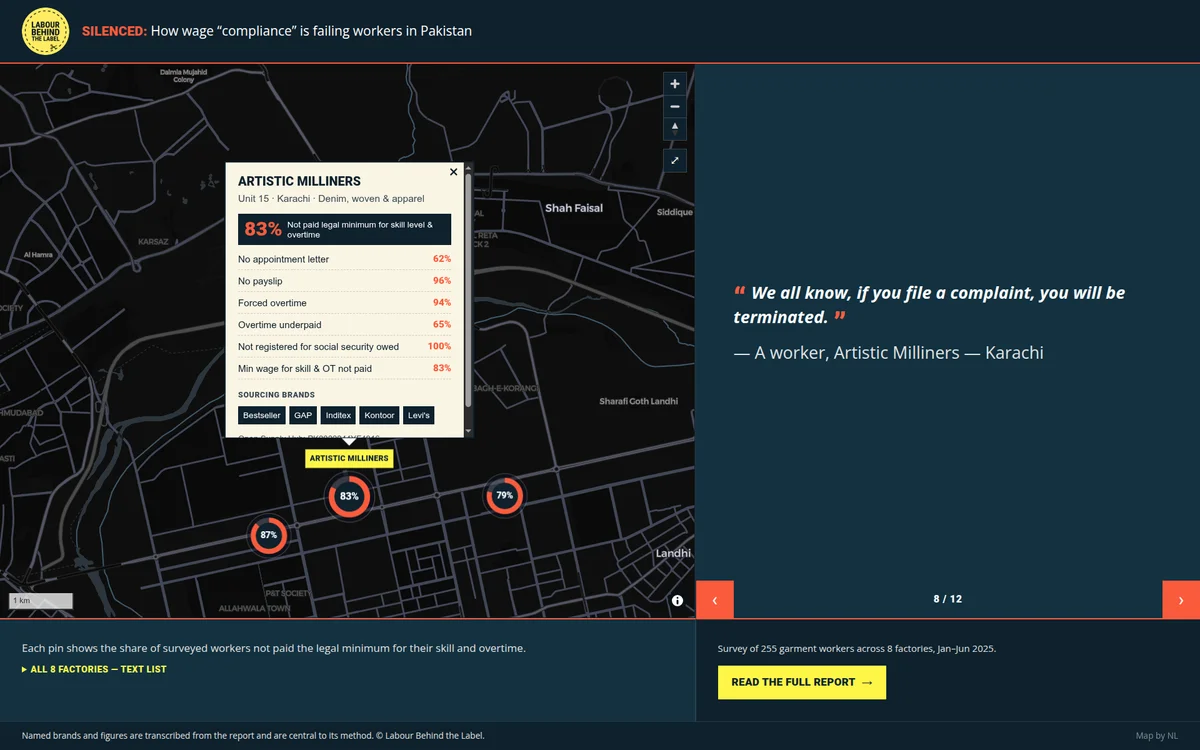
Labour Behind the Label: factory map for the Silenced report
Labour Behind the Label, 2026
An embeddable map and stat cards from a garment-worker audit
Contact
Tell me what you need and I will reply with next steps.